New Analytics is the name of an LTI feature for Canvas deisgned to provide some insights into student engagement at a course/module level. This is intended to compliment the expanding offering of Analytics available to staff and work alongside Canvas Enhanced Analytics
Enabling New Analytics
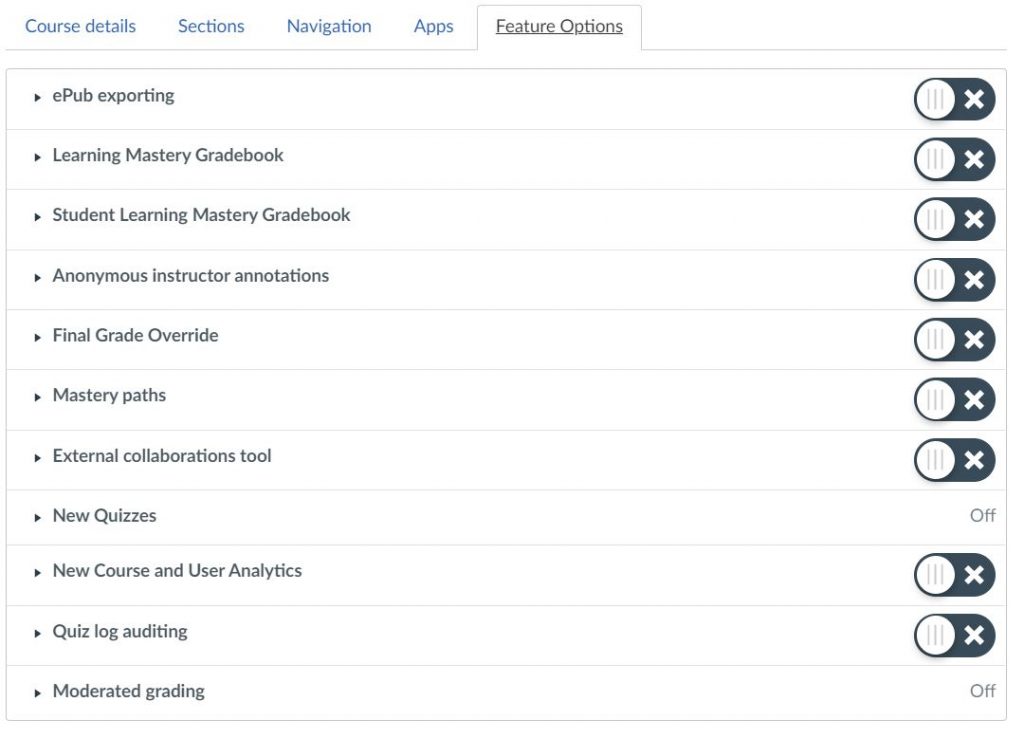
New Analytics can be enabled at a course level by navigating to Settings and selecting Feature Options>New Course and User Analytics

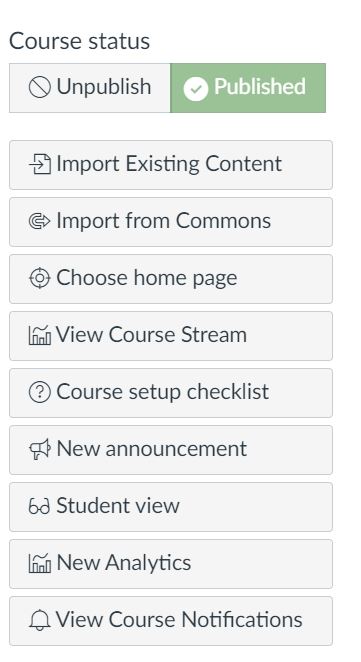
Once Enabled the option should appear on the home page side bar at the upper right

Using New Analytics
Currently, New Analytics allows tutors to track average course grades for student submissions using an interactive chart graph or table. Data is for viewing only and cannot directly be changed.
Page views and participation metrics include an aggregate across all devices, including Canvas mobile apps.
It is also possible to use New Analytics to:
- View average course grade analytics as an interactive chart graph or a data table
- Compare the course average with an individual assignment, course section, or student filter using the chart graph comparison or data table comparison
- View average weekly online participation analytics as an interactive chart graph or a data table
- Compare the course average weekly online participation analytics with an individual student or section using the chart graph comparison or data table comparison
- Send a message to all students based on specific course grade or participation criteria
- Send a message to an individual student based on specific course grade or participation criteria
- View course grade and participation analytics for an individual student
- View and download reports on missing, late, or excused assignments, class roster, and course activity.
For any further informationregarding analytics or student engagement, please contact Phil Rothwell in the learning technology team.