Canvas Advanced Analytics
Background
Canvas data has been used for system reporting and high level analysis of system engagement and tool use for several years now. This has provided insights at an institutional level as to how several aspects of digital teaching and learning takes place and has helped identify trends in practice and improve decision making. This project has developed the granularity of the analytics on offer and broadened the scope to cover an increasing number of areas of teaching and learning and the curriculum. Furthermore this has been joined with Registry data to allow Canvas Data to be presented at a Faculty, School, Programme, Module and Individual level. This is improving insights into multiple areas of Teaching and Learning and providing support for these newer approaches to Teaching and Learning online. This paper will briefly outline some of the developments presently taking place for 2020-2021 and some potential developments for the future. These developments have been described as ‘Canvas Advanced Analytics.’
Drivers
Covid-19 has compelled a rapid migration to an online/blended approach to teaching and learning. This has led to the Academic Registrar, PVC Education, and Dean of Teaching and Learning Academy to request the development of processes to extract and present data relating to activity relating to these new approaches. Furthermore TLA conducted a staff survey which garnered ~120 responses an in which many staff expressed a desire to have more insights into monitoring how students were engaging with online learning materials and the course in general. Initial work was presented to Academic Registrar, PVC Education and Dean of TLA and this was then shared with Executive Leadership Team. Developments with respect to Personal Tutors have indicated that access to the data for their tutor groups would also be useful.
Developments
The Teaching and Learning Academy have coordinated with ITS Business Intelligence Team and Academic Registry to extract and analyse the appropriate data in order to develop a series of dashboards relating to Canvas and Curriculum data. This has been supported with the appointment of an intern over the summer. These dashboards have been developed using Power BI and R and are being shared using the PBI Reporting Server. All dashboards are refreshed on a daily basis and the data is ‘live’ (Canvas Data having latency of about one day before it is uploaded to the data warehouse) The individual analytics dashboards and processes are as follows.
Covid-19 Post Lockdown Engagement
Subsequent to the suspension of face to face teaching and the closure of libraries student Canvas login data was analysed to identify students who had not accessed Canvas from 15th and 23rd March respectively. (see fig 1.1)
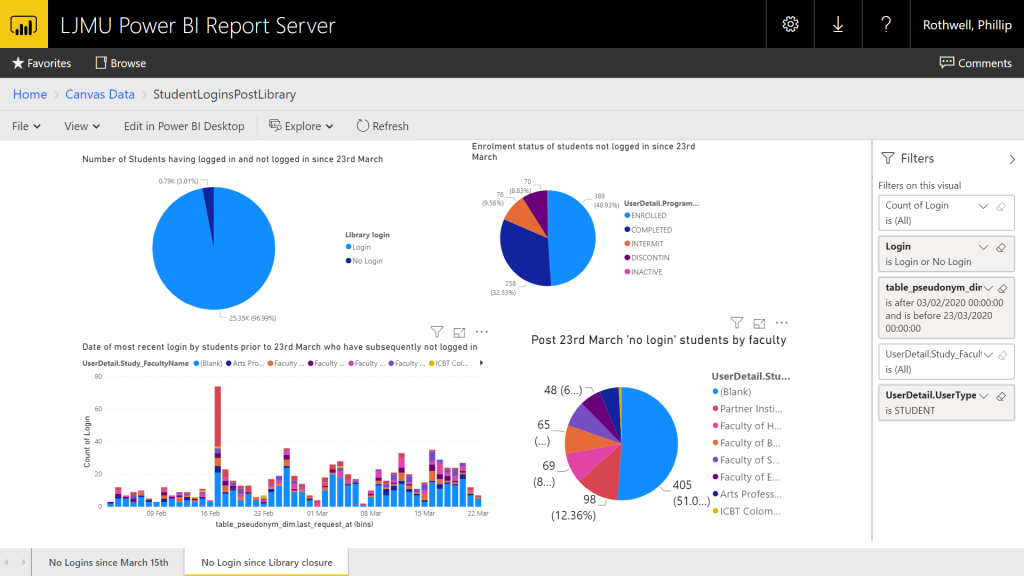
- Post Covid Canvas Access
This data was filtered by faculty and then shared with heads of operations who could decide on an appropriate course of action for each student in question. Students could be sorted by date of most recent login prior to lockdown. Feedback from heads of Operations has been positive and the team are planning to follow up and discuss further developments. One of the key factors would be to automatically filter our PGR students who were included in the initial analysis
Active Blended Learning Engagement
Development of dashboards with the aim of identifying interactions with learning technology tools supportive of Active Blended Learning pedagogy within Canvas (Quizzes, Discussion Boards, Submissions) This data is aggregated and joined with appropriate SIS data to present engagement with the aforementioned tools in a clear visual manner for the programme of study at each level. (see fig 1.2)
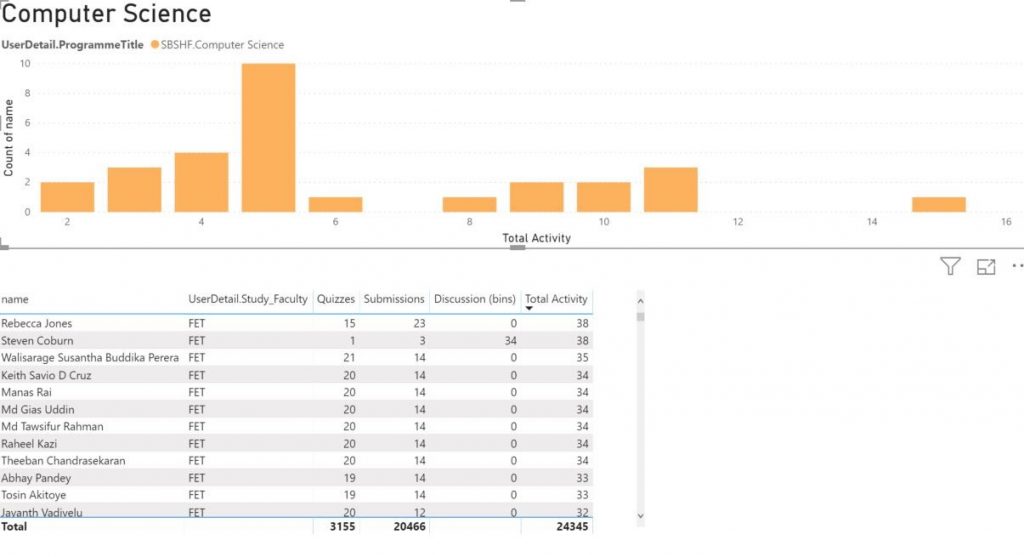
Fig 1.2 Programme Level Active Learning Dashboard (anonymised)
Degree of engagement per student is identified and presented visually and it is straightforward for teaching staff to ‘Drill down’ to identify individual students who are engaging with learning activities to a lesser degree relative to their peers. This data is intended for use from the commencement of the 2020-2021 academic year onwards, though could also be applied retrospectively if required, for example to evidence student engagement to support progression via ‘No Detriment Framework’
Assessment Dashboard
These have been developed to identify assessment deadline distribution subsequent to lockdown. The dashboards presents aggregated data regarding date of deadlines in addition to module and associated module leader data. This information has allowed Faculty Registrars to identify when submissions are taking place and in which school and programme. This has meant, for example, that FRs are able to quickly establish which referral assessment deadlines have not been moved from the original deadline and contact the appropriate Module Leader to take corrective action.(see fig 1.3)
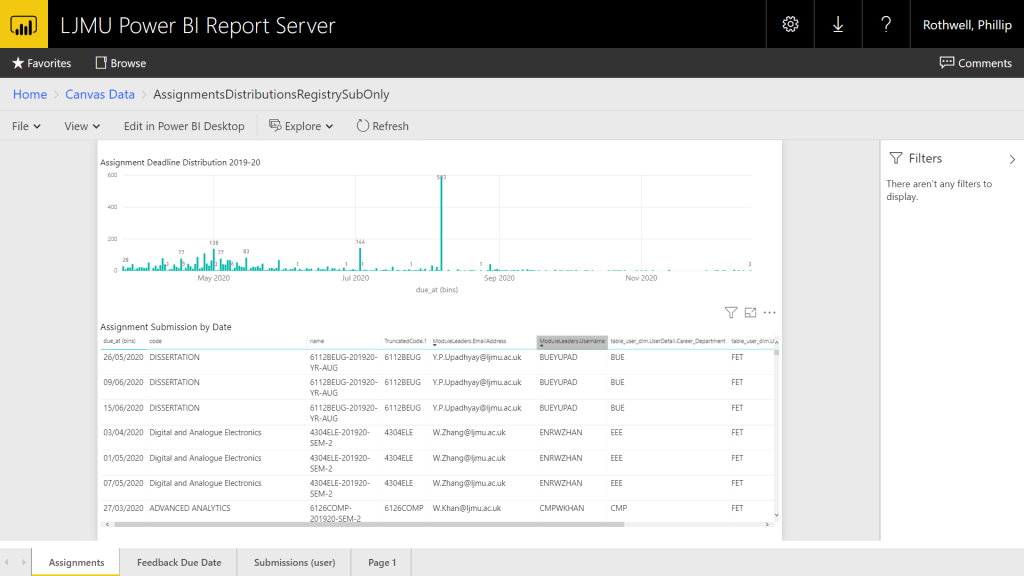
Fig 1.3 Assessment Dashboard
Data Governance
There is an existing TEL DPIA document which references to Canvas Data. Contact with the DPO’s team has indicated that a few minor changes to this document will be sufficient to satisfy GDPR at present. These were in respect to auditing access to the data. It is anticipated that there will be the requirement for an independent DPIA at some point as the use of analytics of this kind develops further. Continued correspondence with the DPO and reviewing the data in use will determine when this becomes necessary.
Access to the dashboards is presently facilitated manually access to information can be requested Access requests are logged. ‘Row level security’ is being implemented to ensure appropriate and scalable access control. This approach ensures that permission to view data will be predicated on being a staff member on a given programme and or being a PL for a particular group of students.
Support and Training
An important component in the use of Analytics is developing the fluency of the data with appropriate stakeholders and a combination of online resources and live synchronous training. Key stakeholders have been identified in the Digital Champions network who will undertake some testing of the dashboards. This is intended to provide feedback for the design and also shape the training and development of staff in how to interpret and use the data.